Introduction
In development studies, measuring the well-being of a population is more complex than simply looking at income levels or GDP. While economic indicators like GDP per capita give an idea of material wealth, they do not reflect the quality of life, health, education, and overall well-being of a population.
To address this gap, the Physical Quality of Life Index (PQLI) was developed in the early 1970s as an alternative method to measure development beyond purely economic terms. PQLI focuses on social indicators that are directly related to human welfare, providing a more human-centered assessment of development.
🌐 Historical Background of PQLI
1. Origin and Development
The Physical Quality of Life Index was developed by Morris David Morris, an American sociologist, in 1979. Morris argued that conventional economic indicators, such as GDP, fail to capture crucial aspects of human development like health and education.
The PQLI was introduced as a simpler and more realistic measure of development, particularly for developing countries where high GDP does not necessarily translate into better living standards.
2. Purpose of PQLI
The main objective of the PQLI is to measure the well-being of a population based on social indicators, rather than economic output. It provides policymakers, researchers, and governments with a more accurate tool for assessing quality of life, identifying development gaps, and planning social interventions.
3. Advantages of PQLI
- Focuses on human welfare rather than economic wealth.
- Enables comparison across countries with different income levels.
- Highlights social disparities and identifies areas for improvement.
- Simple and easy to understand, as it uses only a few key indicators.
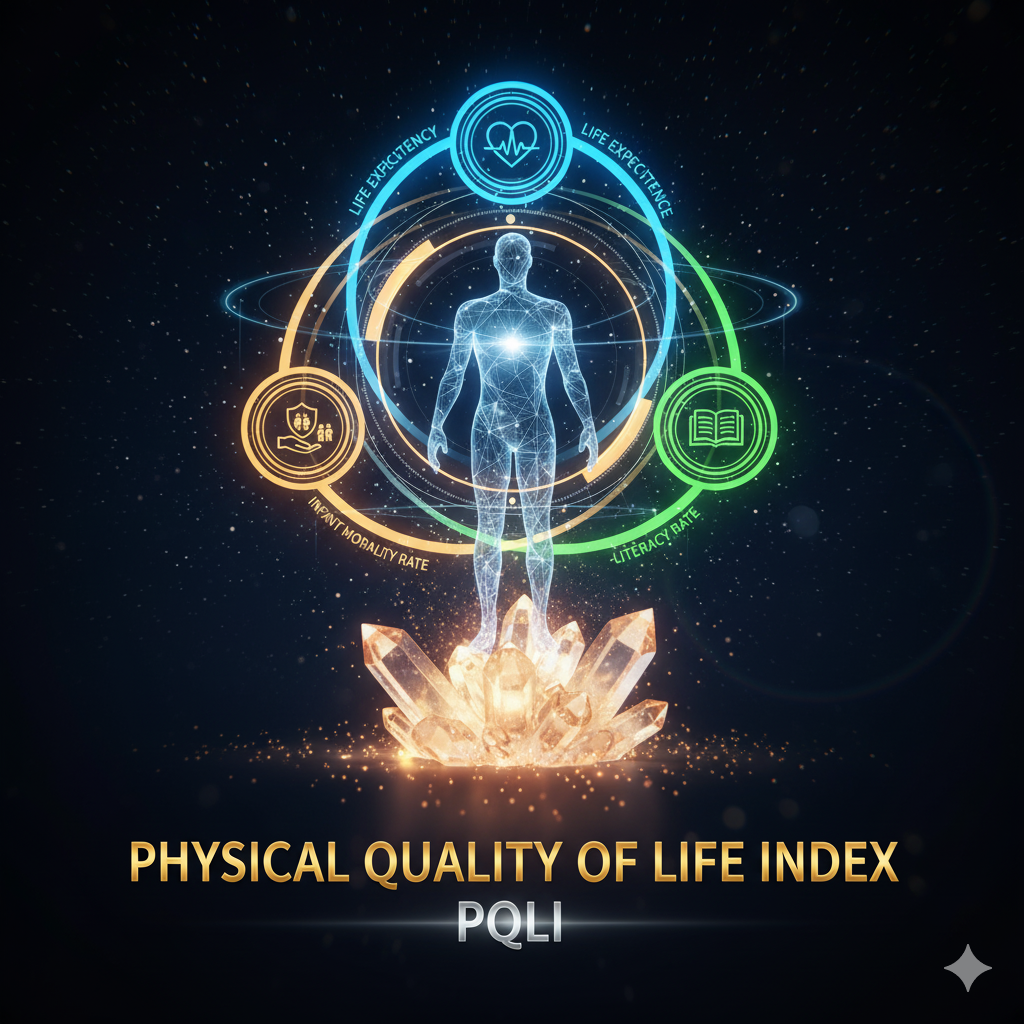
📏 Components of the Physical Quality of Life Index
The PQLI is based on three key indicators that reflect human well-being:
- Infant Mortality Rate (IMR)
- Life Expectancy at Age One
- Literacy Rate
Each of these indicators is standardized on a scale of 0 to 100, where higher values indicate better performance.
1. Infant Mortality Rate (IMR)
- Definition: Infant mortality rate is the number of infants dying before reaching one year of age per 1,000 live births in a given year.
- Significance: IMR is a direct reflection of the health conditions, nutrition, and medical care available in a country. Lower IMR indicates better healthcare and maternal care.
Standardization for PQLI:
- For PQLI, IMR is inverted (because lower IMR is better) and scaled between 0 and 100: IMR Index=100−(Actual IMR−Minimum IMRMaximum IMR−Minimum IMR×100)IMR\ Index = 100 – \left(\frac{\text{Actual IMR} – \text{Minimum IMR}}{\text{Maximum IMR} – \text{Minimum IMR}} \times 100\right)IMR Index=100−(Maximum IMR−Minimum IMRActual IMR−Minimum IMR×100)
- Countries with IMR close to zero get a higher index score.
2. Life Expectancy at Age One
- Definition: Life expectancy at age one represents the average number of additional years a child who has survived the first year of life is expected to live.
- Significance: It is a proxy for overall health conditions, nutrition, and living standards. Longer life expectancy indicates better health infrastructure and quality of life.
Standardization for PQLI:
- Life expectancy is scaled linearly from 0 to 100.
- Higher life expectancy translates directly into a higher PQLI score.
3. Literacy Rate
- Definition: Literacy rate is the percentage of people above the age of 15 who can read and write with understanding.
- Significance: Literacy is crucial for education, empowerment, and socio-economic development. Higher literacy indicates better human development potential and social awareness.
Standardization for PQLI:
- The literacy rate is directly converted into a 0–100 index score.
- Countries with near 100% literacy achieve high scores on this component.
⚖️ Calculating the Physical Quality of Life Index
The PQLI score is calculated as the arithmetic mean of the three standardized indices: PQLI=Life Expectancy Index+Infant Mortality Index+Literacy Index3\text{PQLI} = \frac{\text{Life Expectancy Index} + \text{Infant Mortality Index} + \text{Literacy Index}}{3}PQLI=3Life Expectancy Index+Infant Mortality Index+Literacy Index
- The resulting PQLI score ranges from 0 to 100, with higher scores indicating better quality of life.
- Unlike GDP, PQLI emphasizes human welfare and social development rather than income or wealth.
Example of PQLI Calculation
Suppose a hypothetical country has the following data:
- Life expectancy at age one: 65 years
- Infant mortality rate: 40 per 1,000 live births
- Literacy rate: 80%
Step 1: Standardize each indicator (scale 0–100)
- Life Expectancy Index: 65 (directly)
- IMR Index: 100 – 40 = 60
- Literacy Index: 80
Step 2: Calculate PQLI PQLI=65+60+803=2053=68.33PQLI = \frac{65 + 60 + 80}{3} = \frac{205}{3} = 68.33PQLI=365+60+80=3205=68.33
- The PQLI score of 68.33 indicates moderate quality of life.
🌐 Comparison with Other Development Indicators
1. GDP vs PQLI
- GDP measures economic output, not human welfare.
- A country with high GDP can still have low PQLI if health and education indicators are poor.
- Example: Oil-rich countries with high income but poor literacy and life expectancy may have low PQLI.
2. Human Development Index (HDI)
- The Human Development Index (HDI) developed by UNDP in 1990 is similar to PQLI but includes income per capita along with life expectancy and education.
- PQLI focuses solely on physical quality of life, while HDI integrates economic and educational dimensions.
📊 Global PQLI Trends
1. High PQLI Countries
- Developed countries like Norway, Sweden, and Switzerland have high life expectancy, low infant mortality, and near-universal literacy, resulting in PQLI scores above 90.
2. Low PQLI Countries
- Many developing countries in Sub-Saharan Africa and parts of South Asia face high infant mortality, low life expectancy, and low literacy, resulting in PQLI scores below 50.
3. Regional Disparities
- Even within countries, significant regional disparities exist.
- For example, in India, Kerala has a high PQLI due to high literacy and health standards, while Bihar or Uttar Pradesh has lower scores.
🌿 Significance of PQLI
The Physical Quality of Life Index has several key contributions:
- Human-Centered Approach: Focuses on human welfare rather than just economic growth.
- Policy Guidance: Helps governments prioritize health, education, and social programs.
- Comparative Development Analysis: Allows cross-country comparison using social indicators.
- Social Awareness: Highlights gaps in literacy, health, and infant mortality, encouraging reforms.
- Monitoring Progress: Useful for tracking development over time.
⚠️ Limitations of PQLI
Despite its usefulness, PQLI has several limitations:
- Limited Indicators: Only uses three social indicators; ignores economic inequality, gender disparities, environmental quality, and political freedom.
- Data Reliability: Accurate and timely data for literacy, life expectancy, and infant mortality may not always be available.
- Static Measure: PQLI does not capture dynamic economic and technological changes.
- Weightage Issue: Equal weighting may not reflect the relative importance of indicators.
- Regional Variations Ignored: National-level PQLI may hide disparities between urban and rural areas.
Due to these limitations, PQLI has largely been supplemented or replaced by HDI and Multidimensional Poverty Index (MPI) in modern development studies.
🧩 Related Indices in Development Studies
1. Human Development Index (HDI)
- Developed by UNDP in 1990.
- Components: Life expectancy, education index, and income per capita.
- Provides a more comprehensive measure than PQLI by integrating economic dimension.
2. Gender Development Index (GDI)
- Adjusts HDI for gender inequality.
- Highlights disparities in human development between men and women.
3. Gender Inequality Index (GII)
- Measures reproductive health, empowerment, and labor market participation.
4. Multidimensional Poverty Index (MPI)
- Developed by UNDP and Oxford Poverty & Human Development Initiative.
- Measures deprivations in education, health, and standard of living at the household level.
5. Gross National Happiness (GNH)
- Used by Bhutan.
- Emphasizes holistic well-being, including psychological health, culture, and environment.
📌 PQLI in the Indian Context
1. Historical Perspective
- In the 1970s and 1980s, India had a low PQLI due to high infant mortality, low literacy, and moderate life expectancy.
- States like Kerala, Tamil Nadu, and Himachal Pradesh had higher PQLI due to better healthcare and education systems.
2. Contemporary Status
- Improvements in literacy (77.7% as per Census 2011), life expectancy (~70 years), and declining infant mortality (~28 per 1,000 live births, 2021) have improved India’s PQLI score.
- Yet, regional disparities remain significant:
- Kerala: High PQLI (~80–85)
- Bihar: Low PQLI (~50–55)
- PQLI highlights the importance of social policy interventions in health, education, and gender equality.
3. Policy Implications
- PQLI underscores the need for human development-focused policies, including:
- National Health Mission (NHM)
- Sarva Shiksha Abhiyan (Education for All)
- Mid-Day Meal Scheme (Nutrition and Education)
- Public health infrastructure improvement
- It aligns with India’s Vision 2047 and SDG targets for health, education, and human welfare.
🧭 Way Forward
Even though PQLI is an older measure, it remains relevant for educational and policy purposes. To strengthen development assessment:
- Combine Social and Economic Indicators: Integrate PQLI with HDI and MPI for comprehensive analysis.
- Regional PQLI Studies: Focus on intra-country disparities to guide targeted interventions.
- Data Modernization: Use real-time health and literacy data for accurate assessment.
- Policy Alignment: Prioritize policies that improve health, education, and social welfare.
- Public Awareness: Encourage citizens to engage in health, education, and community welfare.
✅ Conclusion
The Physical Quality of Life Index (PQLI) represents a major shift in development thinking from purely economic metrics to a human-centered approach. By focusing on infant mortality, life expectancy, and literacy, PQLI offers a clear snapshot of social well-being and the effectiveness of development policies.
While it has limitations and has been supplemented by more comprehensive indices like HDI, MPI, and GII, PQLI remains a foundational tool for understanding human welfare and guiding policymakers. For India, PQLI emphasizes that true development lies in improving the quality of life of its citizens, reducing inequalities, and ensuring sustainable social progress.
By prioritizing health, education, and literacy, India can continue to enhance its PQLI, move toward human development goals, and achieve inclusive and sustainable growth.